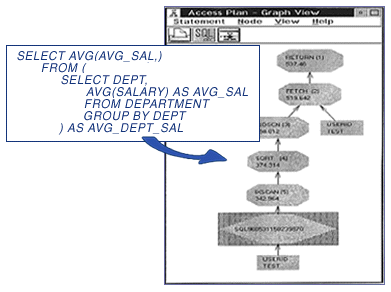
Visual Explain
Visual Explain is a graphical utility that provides a visual representation
of the access plans that the DB2 optimizer uses to obtain data for an SQL
statement.


Visual Explain lets you view queries at varying levels
of detail.

|
You can use Visual Explain to:
- View the details of the access plan including statistics in the system
catablogs.
- Tune SQL statements for better performance.
- Model the impact of environment changes on SQL statements.
- Determine the source of problems in SQL statements.
|


